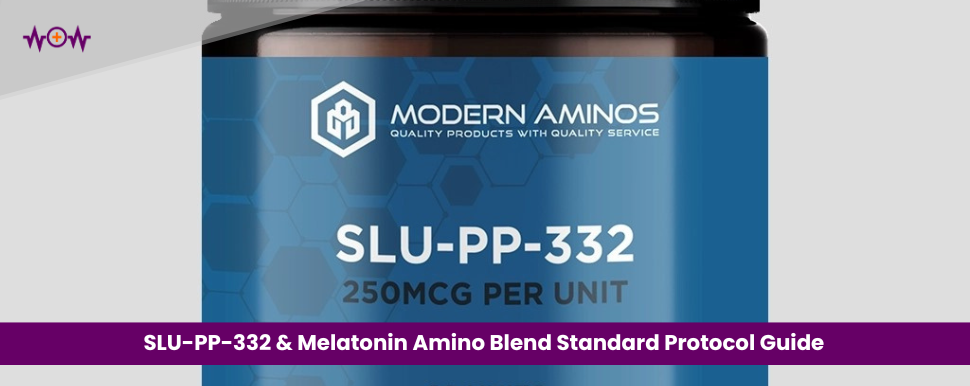


This guide details seven essential protocols for SLU-PP-332 and Melatonin Based Amino Blend materials. Each section and subsection provides in-depth rationale, step-by-step procedures, and best practices. All procedures apply strictly to research and analytical environments—no living-system references.
1. Material Verification
1.1 NMR Spectroscopy
Before use, confirm chemical integrity via NMR. Dissolve SLU-PP-332 at 10 mg/mL in DMSO-d₆. Acquire ^1H spectra at 500 MHz, verifying aromatic peaks (δ 7.00–7.50 ppm) and aliphatic signals (δ 2.50–3.50 ppm). Run ^13C spectra to identify carbonyl and quaternary carbons. For the Melatonin blend, prepare 2–5 mg/mL in D₂O, record both ^1H and ^13C to confirm indole and amino acid moieties. Consistent chemical shifts ensure batch uniformity and detect possible impurities.
1.2 Mass Spectrometry
Use electrospray ionization (ESI) in positive mode on a triple-quadrupole instrument. For SLU-PP-332, monitor the m/z 347.15 → 229.10 transition, confirming sub-ppm mass accuracy. For Melatonin Amino Blend, set MRM transitions for melatonin (m/z 233.15 → 174.10) and each amino component. Regular calibration with a multi-ion mix maintains accuracy within 2 ppm.
1.3 HPLC Purity Assessment
Quantitative purity testing utilizes a reverse-phase C18 column (4.6 × 150 mm, 5 µm). Run a gradient from 5% to 95% acetonitrile (0.1% formic acid) over 20 minutes at 1 mL/min. Detect SLU-PP-332 at 254 nm (accept ≥ 98% area) and Melatonin blend at 210 nm (accept ≥ 95%). Integrate peak-area calculations using validated chromatography software.
1.4 Structural Confirmation via FTIR
Supplement purity data with FTIR analysis. Press KBr pellets of dried samples and record spectra from 4000–400 cm⁻¹. Confirm presence of amide I/II bands (~1650/1550 cm⁻¹) in the blend and characteristic indole vibrations (~1500 cm⁻¹) for melatonin. Compare reference spectra to detect possible functional-group modifications.
2. Handling & Storage
2.1 Aliquoting Under Controlled Conditions
Perform all weighing in a laminar-flow enclosure to limit airborne contamination. Use a humidity-controlled glove box if available. Dispense into amber, screw-cap polypropylene vials (10–20 mg each), minimizing headspace to reduce oxidative degradation.
2.2 Labeling & Traceability
Each vial label must include:
- Unique sample ID
- Lot number and concentration
- Preparation date and initials
Digitally record this metadata in a centralized inventory management system for rapid retrieval.
2.3 Storage Conditions & Monitoring
Store samples at –20 °C in a desiccator or freezer dedicated to low-humidity materials. Employ data loggers that record temperature and relative humidity at 15-minute intervals. Investigate any excursions beyond ± 2 °C or > 10% RH immediately.
2.4 Contamination Prevention & Cleaning
Designate specific work areas and utensils for these materials. Wipe benchtops and equipment with 70% isopropanol before and after use. Use powder-resistant gloves to avoid cross-contamination and change them between operations.
3. Solution Preparation
3.1 Stock Solution Recipes
- SLU-PP-332: Weigh precise mass for 100 mM in DMSO. Vortex until fully dissolved. Dilute to working concentration in 10 mM phosphate buffer (pH 7.4).
- Melatonin Blend: Dissolve in ultrapure water at 1 mg/mL. Adjust pH with 0.1 N HCl or NaOH to desired range (pH 6–8).
3.2 Filtration & Loss Mitigation
Pass all solutions through 0.22 µm low-protein-binding filters (PTFE for SLU-PP-332; PVDF for aqueous blends). Pre-flush filters with 500 µL of buffer to reduce sample adsorption. Record filter lot numbers in your ELN.
3.3 Concentration Verification & Documentation
Measure UV-Vis absorbance: 254 nm (SLU-PP-332; ε = 12,000 L·mol⁻¹·cm⁻¹) and 210 nm (melatonin blend). Generate fresh calibration curves monthly from serial dilutions of certified standards. Log each measurement against the curve in your LIMS.
4. Purification & Fraction Collection
4.1 Solid-Phase Extraction (SPE)
Condition C18 SPE cartridges with:
- Methanol (2 × 5 mL)
- Water (2 × 5 mL)
Load 1–2 mL sample, wash with water, then elute with 50% methanol. Collect 1 mL fractions; evaporate under nitrogen at 30 °C and reconstitute in mobile phase for HPLC.
4.2 Preparative HPLC
Use a preparative C18 column (21 × 250 mm, 10 µm) at 10 mL/min. Optimize gradient (e.g., 10–60% acetonitrile over 30 minutes). Detect at relevant wavelengths, collect target peaks, lyophilize, and weigh to calculate recovery yield.
4.3 Fraction Analysis & Pooling
Analyze each fraction by analytical HPLC and MS. Only pool fractions that meet ≥ 98% (SLU-PP-332) or ≥ 95% (blend) purity. Document pooling ratios and final yield metrics.
5. Analytical Assessment
5.1 HPLC System Suitability
Run five back-to-back injections of a mixed standard; require retention-time RSD < 0.5% and peak-area RSD < 1%. Verify column performance via USP test mixtures monthly.
5.2 Mass Spectrometer Calibration & Tuning
Infuse a multi-component calibration solution daily. Tune gas flows, voltages, and lens settings to achieve < 2 ppm mass error across calibration m/z points. Archive tuning reports with date and operator initials.
5.3 Orthogonal Techniques
In addition to HPLC and MS, perform differential scanning calorimetry (DSC) on dried samples to assess thermal stability. Record melting transitions and compare to reference data.
6. Stability & Degradation Testing
6.1 Accelerated Stability Protocol
Aliquot 1 mL samples into sealed vials. Incubate at 40 °C/75% RH; sample at 0, 3, 7, and 14 days. Analyze degradation kinetics by HPLC; maintain impurity growth ≤ 5% per week.
6.2 Forced-Degradation Studies
Treat separate aliquots with:
- 0.1 N HCl (acid)
- 0.1 N NaOH (base)
- 3% H₂O₂ (oxidative)
Incubate at 50 °C for 24 hours; identify degradants using MS fragmentation patterns.
6.3 Long-Term Shelf-Life Monitoring
Store bulk stock at –20 °C. Pull monthly samples for HPLC/MS over 12 months. Use regression analysis to project shelf life and update expiry dates accordingly.
7. Data Management & Quality Control
7.1 Electronic Lab Notebook (ELN) Practices
Use a secure ELN to document every experimental parameter—instrument ID, batch numbers, lot certificates, and data files. Link raw data (chromatograms, spectra) directly to protocol entries.
7.2 Method Validation Summary
- Linearity: R² ≥ 0.995 across working ranges (0.1–100 µM).
- Precision: RSD ≤ 2% for six replicates.
- Sensitivity: LOD/LOQ established at S/N 3:1/10:1.
7.3 Regulatory Compliance & Auditing
Archive SOP versions and batch certificates in a LIMS. Conduct quarterly internal audits comparing in-house results to supplier CoAs to ensure traceability.
Digital Integration & External Resources
Automate inventory management by linking the ELN to your stock-control software. Generate automated low-stock alerts and reorder notifications. For workflow templates and additional best practices, explore WoW Health.
Conclusion
Adhering to these seven detailed protocols—encompassing verification, handling, solution prep, purification, analytics, stability testing, and data governance—ensures the highest consistency and quality for SLU-PP-332 and Melatonin Based Amino Blend materials. Rigorous documentation, periodic validation, and digital integration minimize variability and enhance confidence in every batch.